
|
Java Console |
Java Console includes the following topics:
Java Console is a simple debugging aid that redirects any System.out
and System.err to the console window. It is available for applets
running with Java Plug-in and applications running with Java Web Start.
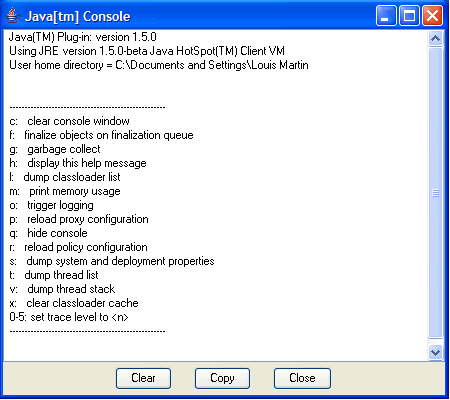
Java Console provides various options as shown below to make applet and application debugging easier.

An action/option is selected by typing its letter/number while the Java Console window has focus.
|
Key
|
Description
|
| c: | Clears the Java Console window. |
| f: | Triggers finalization on the objects in the finalization queue and then displays memory information. Memory refers to the current heap size used by the JRE. Free is the available memory that is free in the heap. The percent (xx%) is the free memory as a percent of the total heap size. |
| g: | Triggers garbage collection and displays memory information as described above. |
| h: | Displays help message, which is being described here. |
| l: | Displays a list of the cached ClassLoader objects in the
Java Plug-in. (These are runtime objects cached in semiconductor memory,
not on disk, and should not be confused with the cached JAR files mentioned
in Applet Caching.) Classes are cached
to avoid having to load them again when returning to previously-visited
pages. When a page is visited the first time, a ClassLoader
object will be created and all of the classes that are downloaded will be
cached in that object. These objects are created and cached according to
their codebase. To identify a ClassLoader object,
the "classloader list" displays the codebase for
that object. Additional information displayed with a ClassLoader
object includes zombie, cache and info.
zombie = true indicates that a ClassLoader object
is not being used (i.e., the applet is not currently loaded on the page).
cache = true indicates that the applet should be cached, while
false indicates that the applet will be destroyed when the
page is left. info is a value used for debugging. |
| m: | Displays heap memory usage as described above. |
| o: | Triggers logging, which directs output from the Java Plug-in Console to a log file. |
| p: | Reloads the proxy configuration. |
| q: | Causes the Java Console to disapper from the main screen. |
| r: | Reloads the policy configuration. |
| s: | Prints out the system properties. This is mostly for debugging. |
| t: | Prints out all the existing thread groups. The first group shown is Group
main. ac stands for active count; it is the total
number of active threads in a thread group and its child thread groups.
agc stands for active group count; it is the number
of active child thread groups of a thread group. pri stands
for priority; it is the priority of a thread group. Following Group
main, other thread groups will be shown as Group <name>,
where name is the URL associated with an applet. Individual listings
of threads will show the thread name, the thread priority, alive
if the thread is alive or destroyed if the thread is in the
process of being destroyed, and daemon if the thread is a daemon
thread. |
| x: |
This removes (destroys) all Modified jar files will be downloaded from the server when a page with an applet is refreshed or revisited if you first do this: type "x" in the Java Console to clear the Classloader cache. |
| 0-5: | This sets the trace-level options as described in the next section, Tracing and Logging. |
When Java Plug-in is running an icon is displayed—in the taskbar for Windows or on the desktop for Solaris. When right-clicked, a menu option displays, allowing the user to Open/Hide the Java Console. Thus the user can open and hide the Java Console any number of times within the same browser session.
Java Console may be shown, hidden, or not started at startup time, as configured through the Java Control Panel in the Advanced tab.