Graph creator/editor interface

|
Move group button: when in this mode, you can move or resize groups of
dots around the graph. Click on the group, and then drag it to the desired
place, or resize it by dragging the borders.
|
|
Drag point button: click on the point you want to move, then drag it ot
the desired point.
|
|
| Drag viewport button: click somewhere on the graph, and then drag it in the desired direction. |

|
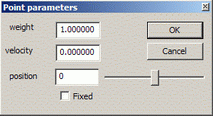
Modify point button: Click on the point you want to change. Dialog will
appear: Weight: affects how fast can dot move. "Light" dots can produce
overflows in sound.
Weight: affects how fast can dot move. "Light" dots can produce
overflows in sound.Velocity: sets initial velocity of the dot. Too "fast" dots can produce major distortions in graph. Position: sets initial position of the dot. Too "high" dots can produce very big distortions in graph. Fixed: can dot move or not. Use it to limit oscillations of the graph. Fast way to (un)fix dots : when in "Modify point" mode, click on the point while holding "CTRL" key. |

|
Modify link: click on the link you want to change, dialog with parameter
"Stifness" will appear. Stifness affects how hard it is to bend this link. |

|
Delete point button: click on the point you want to remove.
|
| Delete link button: click on the link you want to remove. |

|
Add point/link button: clicking on the point will link it to the next
clicked point. Clicking on the free space will create new point. If you want to add point to the existing group, when in "Add
point/link" mode click somewhere inside group bounding box. |

|
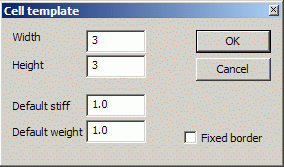
Cell graph button: Adding of the cell graph. Dialog will appear: Width, height: number of points.
Default stifness: sets initial stifness of the links. The bigger the stifness - the more it takes to disturb graph. Stifness=8 sets a water-like behaviour of the graph. Default weight: sets initial weight of the links. Fixed border: will the border of the graph be fixed. |

|
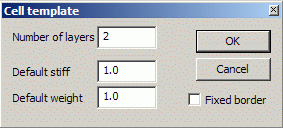
Hexagonal graph button: Adding of the hexagonal graph. Dialog will
appear: Number of layers: number of layers of the geid from center.
Default stifness: sets initial stifness of the links. The bigger the stifness - the more it takes to disturb graph. Stifness=8 sets a water-like behaviour of the graph. Default weight: sets initial weight of the links. Fixed border: will the border of the graph be fixed. |

|
Playing point button: selects the point from which you want to take
sound.
Setting playing point to the point with high amplitude can produce noise and unpleasant sounds. |

|
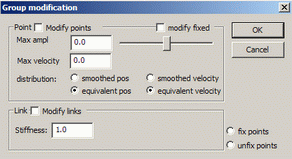
Modify group button: by dragging the rectangle select the group of dots
you want to modify. Dialog will appear: Modify fixed:will modification affect fixed points or
not. Modify fixed:will modification affect fixed points or
not.Max amplitude: amplitude to set. Max weight: weight to set. The next two group of buttons allows you to control behaviour of velocity and/or point distribution. When set to "equivalent" position, every dot in the selection will get specified properties. When set to "smoothed" position, points situated further from the center of the selection will get less distortion than those situated closer. Stifness: every link caught in the selection will get this stifness. Fix/unfix points:check it if you want to make every dot in the selection fixed/unfixed. |

|
Merge 2 groups Allows you to connect or merge 2 group of points. After
clicking, dialog will appear, prompting to choose which type do you need. After selecting, choose one group of points, and then another.
It will then try to connect one group to the another. If merging was selected -
first group will be deleted, and all their conenction will be transfered to the
second group. If conencting was selected - only links between groups will appear. After selecting, choose one group of points, and then another.
It will then try to connect one group to the another. If merging was selected -
first group will be deleted, and all their conenction will be transfered to the
second group. If conencting was selected - only links between groups will appear.
|

|
Zoom in/out: Allows you to zoom in/out graph. |

|
New: Clears the editor screen. Load: Load the previously saved graph. Save: Saves the graph. |

|
| In the status bar(it's situated at the bottom of the graph editor) you can find information about properties of links and points. |
